Part 1: Intro to Kinematics and Quadratics
This project was in an in depth view of kinematics, and then quadratics. The first thing that we did in this project was learn about Kinematics. Kinematics have to do with speed and forces acting upon moving objects. The first type of movement we looked at was an object that is moving at a constant speed of 30 mph, which if graphed in a velocity vs time graph looks like a straight line and the first picture on the slideshow below. If we looked at a distance vs time graph of a constant speed of 30 mph it would look like the second picture on the slideshow below. We next looked at a distance vs time graph, and realized that we can find the velocity of the graph by calculating the slope. For example the first graph below has a velocity of 0 because the slope of the line is 0, and the velocity of the second graph is 30 because the slope of the line is 30. We then realized that you can find the distance traveled at a given point by calculating the area under the line. We next learned some terms, Vo= Initial Velocity, Vf= Final Velocity, t= time, and a= acceleration. All of this lead us to deriving the displacement equation with algebra and geometry.
This project was in an in depth view of kinematics, and then quadratics. The first thing that we did in this project was learn about Kinematics. Kinematics have to do with speed and forces acting upon moving objects. The first type of movement we looked at was an object that is moving at a constant speed of 30 mph, which if graphed in a velocity vs time graph looks like a straight line and the first picture on the slideshow below. If we looked at a distance vs time graph of a constant speed of 30 mph it would look like the second picture on the slideshow below. We next looked at a distance vs time graph, and realized that we can find the velocity of the graph by calculating the slope. For example the first graph below has a velocity of 0 because the slope of the line is 0, and the velocity of the second graph is 30 because the slope of the line is 30. We then realized that you can find the distance traveled at a given point by calculating the area under the line. We next learned some terms, Vo= Initial Velocity, Vf= Final Velocity, t= time, and a= acceleration. All of this lead us to deriving the displacement equation with algebra and geometry.
Part 2: Exploring Parabolas
In this part of the project we used a program called Desmos very heavily. This is a very good graphing program that helped visualize the parabolas that we worked on. One of the first things that we learned about parabolas was some different parts about them. The point where the parabola meets up and starts to curve back up, it is called the vertex and labeled in the first picture in the slideshow below. The next things we learned were the x intercepts and the y intercepts, are the points where the parabola intersects the x and y axis, these are also labeled on the first picture in the slideshow below. When a parabola concaves up the vertex goes down, and when a parabola concaves down the vertex is down, the vertex goes up, as shown in the second picture in the slideshow below. Once we learned the parts of a parabola we looked at the simplest parabola there is: x^2 as shown in the third picture in the slideshow below. x^2 concaves up and has it's vertex at 0,0. We then looked at what happens if we put a number in front of x^2, known as a. What we learned was that if a's value is between 0 and 1 the parabola will become very wide, as shown in the fourth picture below. The equation to get the parabola shown in the fourth picture below is 0.1x^2. If the value of a is greater than 1 then the parabola becomes thinner, as shown in the fifth picture below with the equation of 2x^2. The next variable we looked at was k, in this equation: x^2+k. We learned that if we put k as three the parabola would move up three vertical spaces as shown in the sixth picture in the slideshow below. If k is negative three the parabola will move down three spaces as shown in the seventh picture in the slideshow below. After we learned about k, we learned about h in the equation (x-h)^2. We learned that if you replace h with three, the parabola would move over three spaces to the right, as shown in the eighth picture in the slideshow below. If h is replaced with -3, the parabola moves over 3 spaces to the left, as shown in the 9th picture in the slideshow below. Next we realized that the h, and k values are the vertex of the parabola. After we learned what a, h and k do to a parabola we learned a way to write an equation of a parabola in a way that incorporates all of these variables known as vertex form. The equation is y=a(x-h)+k.
In this part of the project we used a program called Desmos very heavily. This is a very good graphing program that helped visualize the parabolas that we worked on. One of the first things that we learned about parabolas was some different parts about them. The point where the parabola meets up and starts to curve back up, it is called the vertex and labeled in the first picture in the slideshow below. The next things we learned were the x intercepts and the y intercepts, are the points where the parabola intersects the x and y axis, these are also labeled on the first picture in the slideshow below. When a parabola concaves up the vertex goes down, and when a parabola concaves down the vertex is down, the vertex goes up, as shown in the second picture in the slideshow below. Once we learned the parts of a parabola we looked at the simplest parabola there is: x^2 as shown in the third picture in the slideshow below. x^2 concaves up and has it's vertex at 0,0. We then looked at what happens if we put a number in front of x^2, known as a. What we learned was that if a's value is between 0 and 1 the parabola will become very wide, as shown in the fourth picture below. The equation to get the parabola shown in the fourth picture below is 0.1x^2. If the value of a is greater than 1 then the parabola becomes thinner, as shown in the fifth picture below with the equation of 2x^2. The next variable we looked at was k, in this equation: x^2+k. We learned that if we put k as three the parabola would move up three vertical spaces as shown in the sixth picture in the slideshow below. If k is negative three the parabola will move down three spaces as shown in the seventh picture in the slideshow below. After we learned about k, we learned about h in the equation (x-h)^2. We learned that if you replace h with three, the parabola would move over three spaces to the right, as shown in the eighth picture in the slideshow below. If h is replaced with -3, the parabola moves over 3 spaces to the left, as shown in the 9th picture in the slideshow below. Next we realized that the h, and k values are the vertex of the parabola. After we learned what a, h and k do to a parabola we learned a way to write an equation of a parabola in a way that incorporates all of these variables known as vertex form. The equation is y=a(x-h)+k.
Part 3: Other Quadratic Equation Forms
There are other ways to write quadratic equations, such as standard and factored forms. Standard form is this equation: y=ax^2+bx+c. This equation is good because it shows you where the y intercept is. The next form that is also useful is factored form. Factored form is this equation: y=a(x-m)(x-n). This form is useful because it will tell you the x intercepts. The picture below is three different equations of a parabola in each of the three forms I talked about above. The first one is in vertex form, the second one is in standard form, and the third one is in factored form. All of the parabolas are stacked on top of each other because they are all the same but in different forms.
There are other ways to write quadratic equations, such as standard and factored forms. Standard form is this equation: y=ax^2+bx+c. This equation is good because it shows you where the y intercept is. The next form that is also useful is factored form. Factored form is this equation: y=a(x-m)(x-n). This form is useful because it will tell you the x intercepts. The picture below is three different equations of a parabola in each of the three forms I talked about above. The first one is in vertex form, the second one is in standard form, and the third one is in factored form. All of the parabolas are stacked on top of each other because they are all the same but in different forms.
Part 4: Converting Between Forms
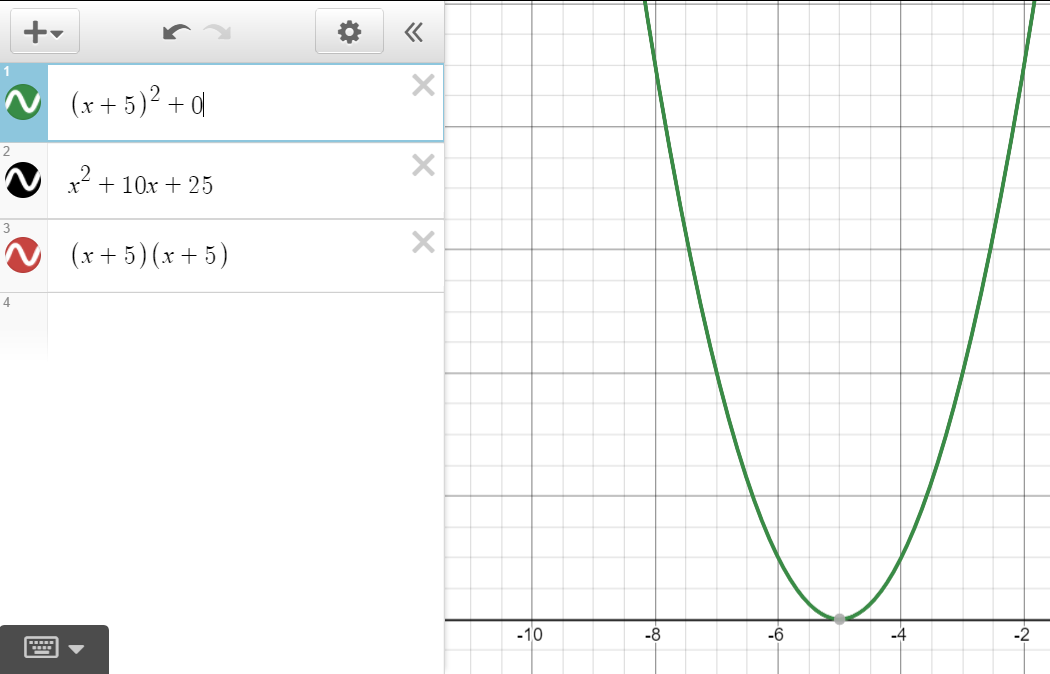
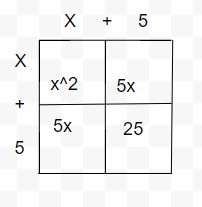
In this section I am going to explain how to convert from vertex form to standard form, standard form to vertex form, factored from to standard form, and standard form to factored form. To convert from Vertex form to standard for you have to use the process of completing the square. For example, if you have an equation in vertex form such as: (x+5)^2+3 your first step is to draw an area diagram. Draw a square and draw a plus in the square so there are four equal parts in the square. Take the portion of the equation that is in the parentheses and write out x+5 on the side of the area diagram, the plus sign being where the line that divides the square is. It should look like in the first picture in the slideshow below. Your next step is to multiply the numbers together, for example x*x= x^2 so you should put x^2 in the box that both of them are adjacent to. Do this to all of the squares, it should look like the second picture in the slideshow below. Now just add all of the terms together, but don't forget the other 3 in the original equation. (x+5)^2+3 in standard form is x^2+10x+28. If you look at the third picture in the slideshow below the equations are equal when graphed.
In this section I am going to explain how to convert from vertex form to standard form, standard form to vertex form, factored from to standard form, and standard form to factored form. To convert from Vertex form to standard for you have to use the process of completing the square. For example, if you have an equation in vertex form such as: (x+5)^2+3 your first step is to draw an area diagram. Draw a square and draw a plus in the square so there are four equal parts in the square. Take the portion of the equation that is in the parentheses and write out x+5 on the side of the area diagram, the plus sign being where the line that divides the square is. It should look like in the first picture in the slideshow below. Your next step is to multiply the numbers together, for example x*x= x^2 so you should put x^2 in the box that both of them are adjacent to. Do this to all of the squares, it should look like the second picture in the slideshow below. Now just add all of the terms together, but don't forget the other 3 in the original equation. (x+5)^2+3 in standard form is x^2+10x+28. If you look at the third picture in the slideshow below the equations are equal when graphed.
Here is how you convert from standard form to vertex form. To do this you must make another area diagram, and to make this easy I am going to use the same equation that I used above: x^2+10x+28. To get this to into vertex form look at the area diagram in the picture below. To get this from the standard form equation you would split the first two terms in half and put them on the top of the area diagram. The area diagram is just another way of expanding the equation (x+5)(x+5) or (x+5)^2. You can figure this out by looking at the x+5 on the top. So (x+5)^2 is your equation, save for one thing. To get the +3 that is supposed to be there you have to subtract the 28 that is in the original equation with the 25 that is in are area diagram to get 3. So our final answer is (x+5)^2+3, witch as you can see in the third picture in the slideshow above is equal to the standard form equivalent.
This is how you can convert from factored from to standard form. The equation that we are going to be using to demo this is: x^2+14x+49. The first thing I like to do is to draw an label an area diagram with what I know, like I did in the first picture in the slideshow below. I labeled the sides next to the plus signs m and n, and this is because we don't know what those values are yet, but we know some things about the values that we can use to our advantage. m*n must equal 49 and m+n must equal 14. We can use these facts to see what m and n are by trying different values, and in this case m and n both equal 7. This is because 7+7=14, and 7*7=49. Now you know that (x+7)^2 is the same as the standard form equation above. But to make this in factored form you have to write out the equation, like this: (x+7)(x+7). As you can see in the second picture in the slideshow below, (x+7)(x+7) and x^2+14x+49 are equal.
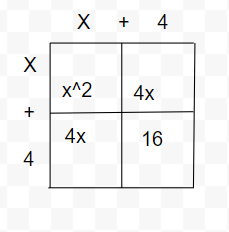
This is how you convert from factored form to standard form. The first thing you have to do is draw an area diagram. The equation that I am going to be using is (x+5)(x+5). If you write this out on an area diagram it should look like the picture below. Now you just add all of the terms together to get the standard form of the equation. In this case it would be x^2+8x+16.
Part 5: Quadratic Equation Real-Life Problems
By learning all that we did in this unit we can now solve three real world problems, Kinematics problems, Geometry problems, and Economics problems. For Kinematics problems at the beginning of the unit we were given a series of problems about a rocket. The equation for the height of the rocket as a function of time is: h(t)=80+64t-16t^2. Unsurprisingly, this equation is a quadratic equation and this equation can be used to answer a number of questions, namely how high did the rocket go. To answer this question you can either convert the equation into vertex form and look at the h, and k values in the equation, or you can graph the parabola and see where the vertex is. The maximum height it reached is 292.25 ft. The first picture in the slideshow below is of the equation of the rocket graphed, and as you can see in the picture the y (or height) value equals 292.25 ft or the answer. For Geometry problems we can now solve problems like this one: The length of a rectangle is 6 more units than the rectangles width. The area of the rectangle is 91, find the dimensions of the rectangle. To do this the first thing I did was draw a diagram, witch is shown in the second picture in the slideshow below. I used the equation to find the area of a rectangle, l*w and plugged in our equations for length and width in them. I got: x(x+6)=91 and if we distribute the x we get: x^2+6x=91 witch is a quadratic equation. What we need to do with this equation is find the x intercepts and those will be the dimensions, to do this you can calculate for them, or graph the parabola, which I have done in the third picture in the slideshow below. As you can see the x intercepts are 7 and -13 (you can ignore the negative sign) and if you multiply them together you get 91, the number we were looking for. Next I am going to talk about economics problems I can solve now due to my understanding of quadratics. The problem we solved with economics was a problem involving a company that wanted to sell products. The marketing director says that the higher price the product the less the people will buy. So he made the equation 70000-200d, they will be able to sell 70000-200d products if they charge d dollars. We were tasked with finding the maximum amount of money the company could charge while still making the highest profit available. We did this by creating the quadratic equation −200P^2 + 92,000P − 8,400,000, and either solving it to find the maximum amount of profit, or graphing and looking at the vertex, like I have done in the last picture in the slideshow below. As you can see the maximum amount of prophet is 230$, witch is the same thing you would get if you solved the equation.
By learning all that we did in this unit we can now solve three real world problems, Kinematics problems, Geometry problems, and Economics problems. For Kinematics problems at the beginning of the unit we were given a series of problems about a rocket. The equation for the height of the rocket as a function of time is: h(t)=80+64t-16t^2. Unsurprisingly, this equation is a quadratic equation and this equation can be used to answer a number of questions, namely how high did the rocket go. To answer this question you can either convert the equation into vertex form and look at the h, and k values in the equation, or you can graph the parabola and see where the vertex is. The maximum height it reached is 292.25 ft. The first picture in the slideshow below is of the equation of the rocket graphed, and as you can see in the picture the y (or height) value equals 292.25 ft or the answer. For Geometry problems we can now solve problems like this one: The length of a rectangle is 6 more units than the rectangles width. The area of the rectangle is 91, find the dimensions of the rectangle. To do this the first thing I did was draw a diagram, witch is shown in the second picture in the slideshow below. I used the equation to find the area of a rectangle, l*w and plugged in our equations for length and width in them. I got: x(x+6)=91 and if we distribute the x we get: x^2+6x=91 witch is a quadratic equation. What we need to do with this equation is find the x intercepts and those will be the dimensions, to do this you can calculate for them, or graph the parabola, which I have done in the third picture in the slideshow below. As you can see the x intercepts are 7 and -13 (you can ignore the negative sign) and if you multiply them together you get 91, the number we were looking for. Next I am going to talk about economics problems I can solve now due to my understanding of quadratics. The problem we solved with economics was a problem involving a company that wanted to sell products. The marketing director says that the higher price the product the less the people will buy. So he made the equation 70000-200d, they will be able to sell 70000-200d products if they charge d dollars. We were tasked with finding the maximum amount of money the company could charge while still making the highest profit available. We did this by creating the quadratic equation −200P^2 + 92,000P − 8,400,000, and either solving it to find the maximum amount of profit, or graphing and looking at the vertex, like I have done in the last picture in the slideshow below. As you can see the maximum amount of prophet is 230$, witch is the same thing you would get if you solved the equation.
Part 6: Reflection
In this section I am going to be talking about The Habits Of A Mathematician. These are habits that every mathematician uses very often and I am going to be explaining how I used all of them.
Look for Patterns: I looked for patterns at the beginning of this unit when we were seeing what a, h and k do to a parabola.
Start Small: Everyone in the class started small when we all solved the simpler rocket problem at the end of the unit before going back and solving the harder one that we began the unit with.
Be Confident Patient and Persistent: I was very patient and persistent in assignments were we had to solve many problems. I was confident in my ability to solve them, but I just had to be patient and persistent when there was many problems in a row.
Seek Why & Prove: I asked many questions on why things were the way they were throughout this project. For example, I asked why quadratic equations have the prefix quad (meaning four) when squaring an equation makes it quadratic.
Describe and Articulate: Throughout this project I have drawn many diagrams, mainly parabolas and area diagrams, but they help a lot when solving quadratic equations.
Stay Organized: When I solve problems I always make my work as organized as possible, so if someone needs to see my work they can understand it.
Conjecture and Test: When trying to figure out what a, h and k do to a parabola I had to do a lot of conjecturing and testing to see what happens to the parabola.
Collaborate and Listen: During the beginning of the project we collaborated with peers to make sketches of the rocket that the unit began with. We listened to each other and made a good looking rocket.
Take Apart & Put Back Together: In Leslie's Flowers and Emergency at Sea I took apart and put back together the triangles that were part of the problem.
Be Systematic: Before I knew how to calculate for a, I would put a parabola in desmos and change the a value very slightly until I got the desired x or y intercept.
Generalize: I generalized in the continuation of the corral problems where I made many equations.
Overall in this project I learned a lot. At first it built on the forces and basic Kinematics knowledge that I learned in 9th grade physics, and then devolved into a different leg of math I had never seen before. I think that this content will really help me for 11th grade math and in the future. I think I am prepared for grade 11 math, but I don't know if I am ready for the SAT ready. When taking the PSAT there is still problems in that I don't know how to solve. I think by the end of the next year I might be ready for the SAT.
